Opaque Build Status
Need to log into multiple systems to check build status, unable to quickly understand overall progress.
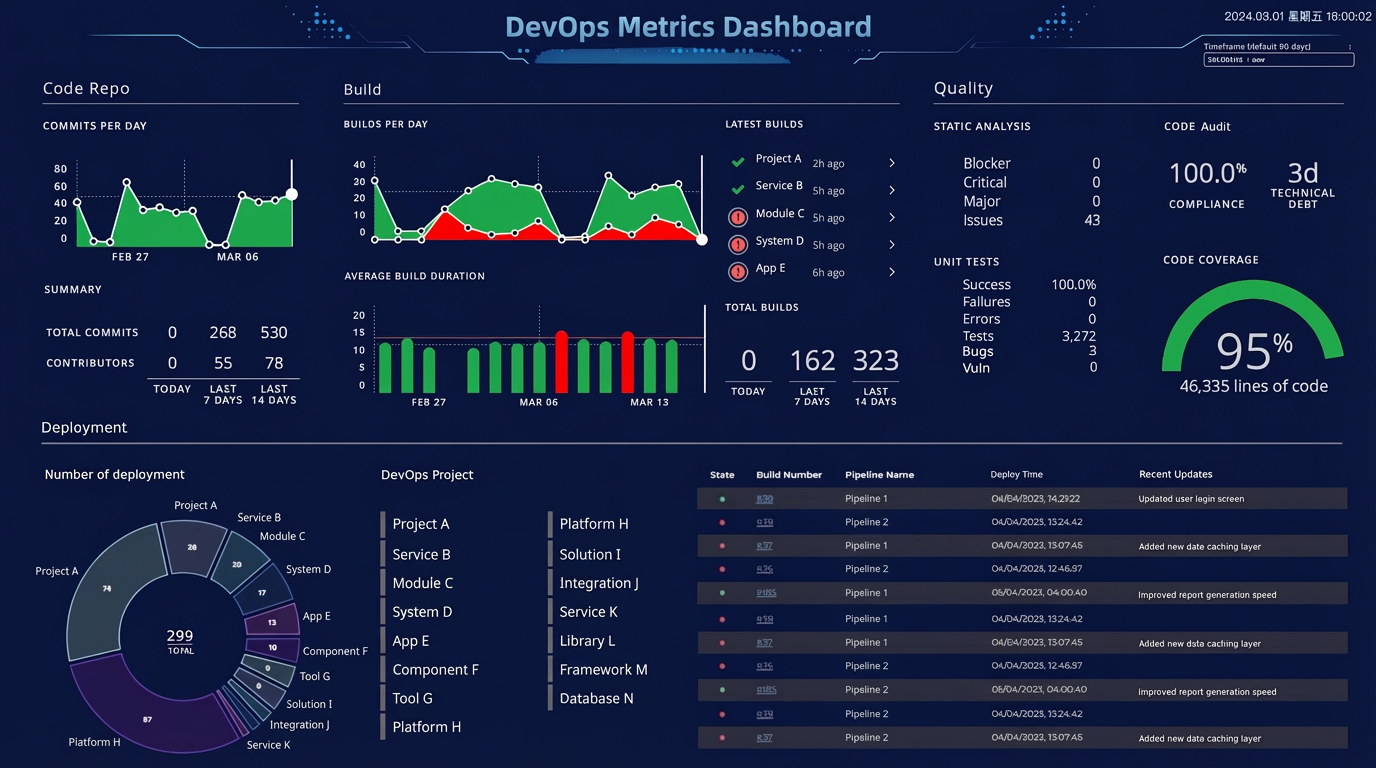
Enterprise DevOps visualization platform: Real-time build status tracking, code quality analysis, deployment monitoring, and big screen display. Keep your team informed of every stage of software delivery.

Typical monitoring and collaboration pain points DevOps teams encounter daily.
Need to log into multiple systems to check build status, unable to quickly understand overall progress.
Code quality data scattered across different tools, difficult to view and compare uniformly.
Lack of unified visualization dashboard, team members cannot quickly sync project status.
One-stop DevOps visualization monitoring solution.
Track real-time status of every CI/CD build, support multi-project parallel monitoring with auto-refresh.
Integrated with SonarQube and other tools, displaying code coverage, bug count, code smell and key metrics.
Record detailed deployment information including time, status, environment, version and complete history.
TV big screen optimized, auto-scaling layout, real-time data refresh, perfect for team area display.
Modern frontend tech stack with cloud-native deployment.
Built on React 18, Vite for fast development, modern component architecture.
Powerful data visualization capabilities, supporting various charts with real-time updates.
Redux Toolkit for global state management, clear and controllable data flow.
CodeBuild + CodeDeploy automated deployment, cloud-native architecture.
Multiple ways to quickly explore DevOps Dashboard.
Direct access to online demo to experience full features.
Visit DemoView complete source code and implementation details.
View SourceComplete deployment and usage documentation guide.
View DocsData auto-refreshes every 5 minutes, keeping the latest status.
Supports all screen sizes, from mobile to big screen TV.
Integrated Authing authentication, supporting enterprise SSO login.
Common questions about DevOps Dashboard.
Experience enterprise-grade CI/CD visualization platform and boost your team collaboration efficiency.